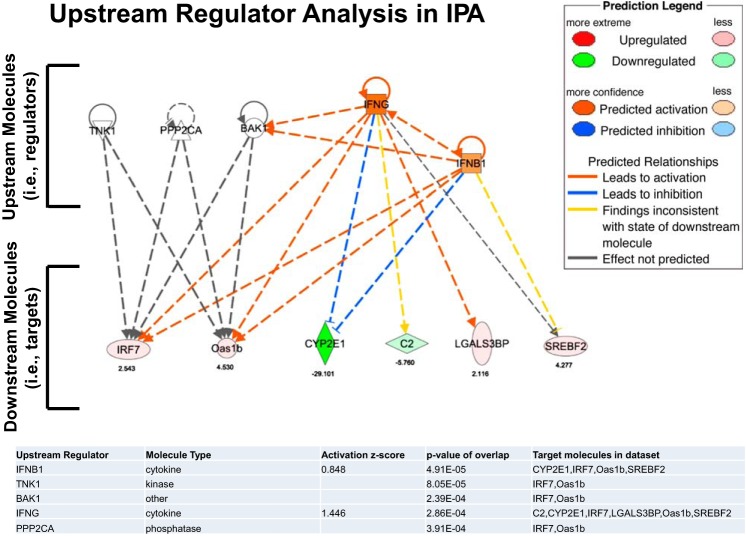
Fig. 9.
Diagram summarizing the results obtained by Upstream Regulator Analysis in IPA. This analysis identifies upstream molecules (i.e., regulators) that are causally connected to a subset of genes (i.e., downstream molecules or targets) consistently affected by obesity across all 15 arteries. Data are presented for the top 5 regulators. Values below the symbols indicate fold difference.

