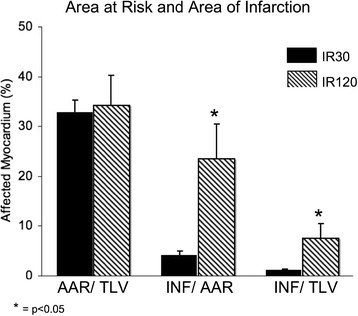
Figure 2.

Myocardial area at risk and infarcted area. This figure illustrates the percentage of the total left ventricle at risk as determined by Evans blue dye, the percentage of the area at risk that ultimately infarcted as determined by TTC staining, and the percentage of the total left ventricle that ultimately infarcted as determined by TTC staining. *p < 0.05 as compared to IR30. AAR, area at risk; INF, infarcted area; IR30, ischemia-reperfusion, 30-min occlusion group; IR120, ischemia-reperfusion, 120-min occlusion group; TLV, total left ventricle.
