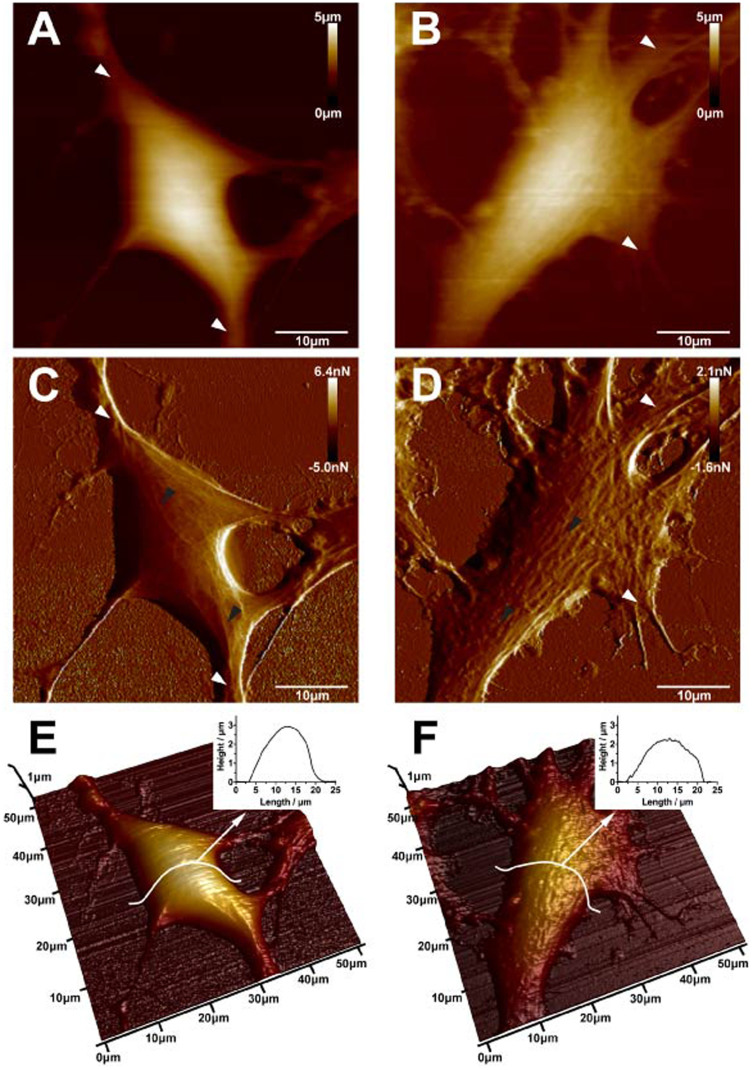
Figure 3. AFM topographic images of normal SH-SY5Y cells (A, C, and E) and 200 μM NMDA treated SH-SY5Y cells (B, D and F).
(A) AFM height image, (C) peak force error image and (E) 3-D height image of normal neuronal cells. White arrows in (A) and (C) indicate neurite extension around the cell and black arrows in (C) indicate the filament structures. (B) AFM height image, (D) peak force error image and (F) 3-D height image of NMDA treated neuronal cells. White arrows in (B) and (D) indicate the neurite extension around the cell and black arrows in (D) indicate protuberances appeared and aggregated in the soma. (scale bar: 10 µm).

