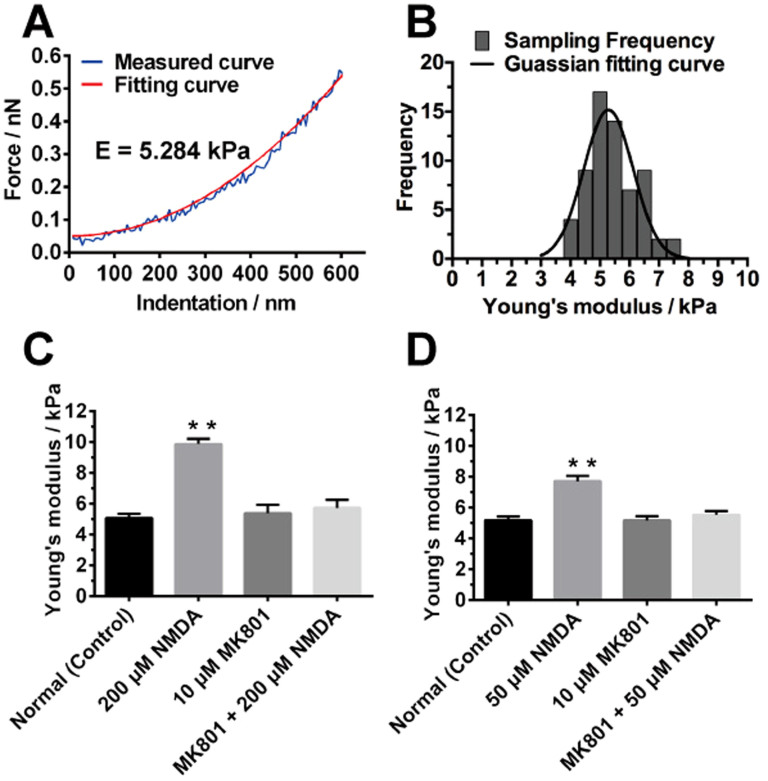
Figure 5.
(A) Force-indentation curve of representative normal SH-SY5Y cells. The fitting curve was obtained by fitting the measured curve using the Sneddon model. (B) Frequency distribution of Young's modulus of representative normal SH-SY5Y cells. The solid curve was fitted by Gaussian distribution. (C) Statistical comparison of Young's modulus of SH-SY5Y cells under different conditions: without treatment (control); with 200 μM NMDA treatment for 1 h; with 10 μM MK801 treatment for 1 h; with 200 μM NMDA and 10 μM MK801 treatment for 1 h. (D) Statistical comparison of Young's modulus of SH-SY5Y cells under different conditions: without treatment (control); with 50 μM NMDA treatment for 1 h; with 10 μM MK801 treatment for 1 h; with 50 μM NMDA and 10 μM MK801 treatment for 1 h. Statistical analysis was conducted by SPSS using One-way ANOVA followed by Newman-Keuls post hoc test (**p<0.01). Data are represented as mean ± SEM (30 samples in triplicates for each condition).

