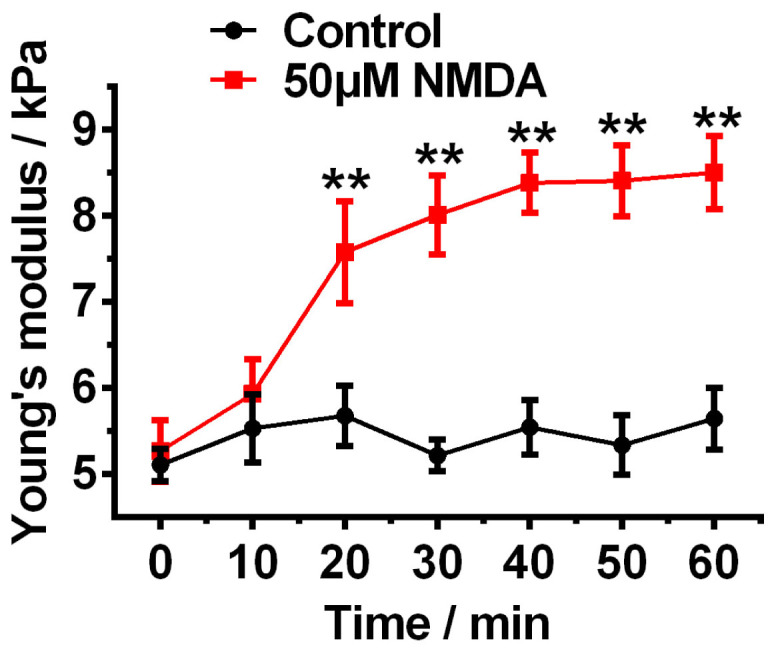
Figure 6. Experimental curve of Young's modulus of SH-SY5Y cells versus duration of the 50 μM NMDA treatment and statistical comparison with the curve of Young's modulus of normal SH-SY5Y cells over the test period (60 minutes).

Statistical analysis was conducted by SPSS using One-way ANOVA followed by Newman-Keuls post hoc test (**p<0.01). Data are represented as mean ± SEM.
