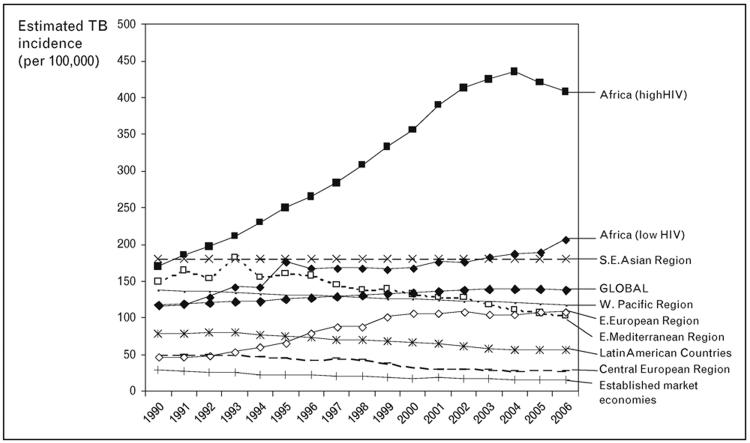
Figure 3. Trends in estimated tuberculosis incidence rates (per 100,000 per year) for the period 1990-2006.
Data are from the 134 countries with the most reliable surveillance systems. Global data and data from nine sub-regions are shown. Source: WHO, 2008 [4*].

