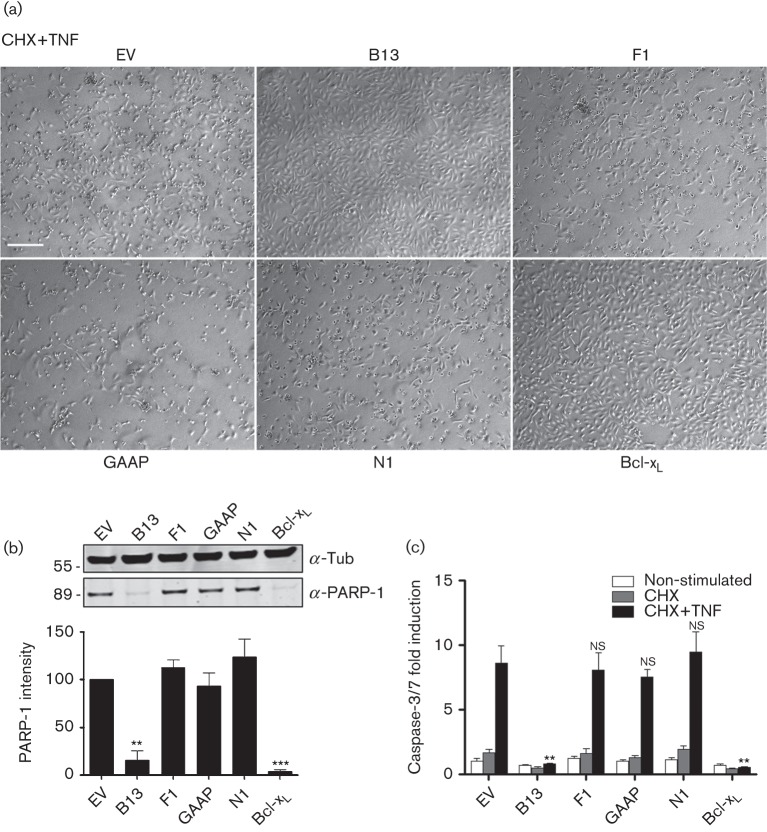
Fig. 2.
Induction of extrinsic apoptosis in the transduced U2-OS cells. (a) Cells were incubated overnight with CHX and TNF-α (10 µg ml−1) for 16 h and then photographed (see Fig. S1 for control). Bar, 200 µm. (b) Cells were incubated overnight with CHX and TNF-α (10 µg ml−1) for 16 h, and lysates were analysed by SDS-PAGE and immunoblotting against cleaved PARP-1 or α-tubulin (Tub). A representative blot of three repeats is shown. Quantitative data were obtained by integrating the intensity of the bands from the three repeats using a LI-COR system. Data were normalized to α-tubulin and are shown as the mean±sd. (c) Cells were incubated overnight with either CHX (30 µg ml−1) or CHX and TNF-α (10 µg ml−1) for 16 h, and apoptosis was assessed quantitatively using Caspase-Glo. Data are shown as the mean±sd fold induction relative to EV and are representative of at least three experiments each performed in triplicate. Statistical differences between EV and anti-apoptotic protein-transduced cells were determined using an unpaired Student’s t-test (*P<0.05, **P<0.01).

