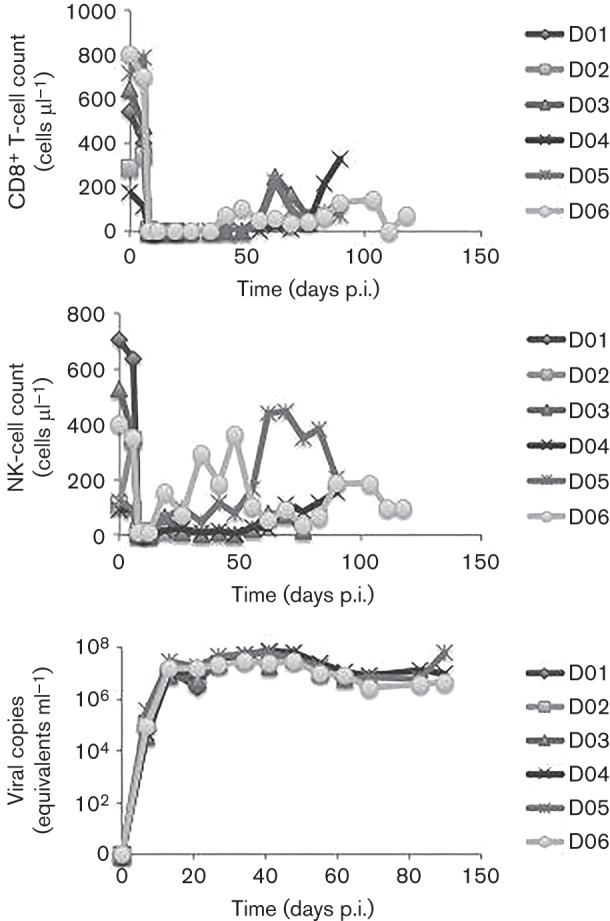
Fig. 1.

Absolute CD8+ T-lymphocyte and NK-cell counts as well as viral load over time in infected macaques D01–D06. Absolute CD8+ T-lymphocyte (top panel) and NK-cell (middle panel) counts (y-axis) and viral load (bottom panel) were monitored periodically using flow cytometry.
