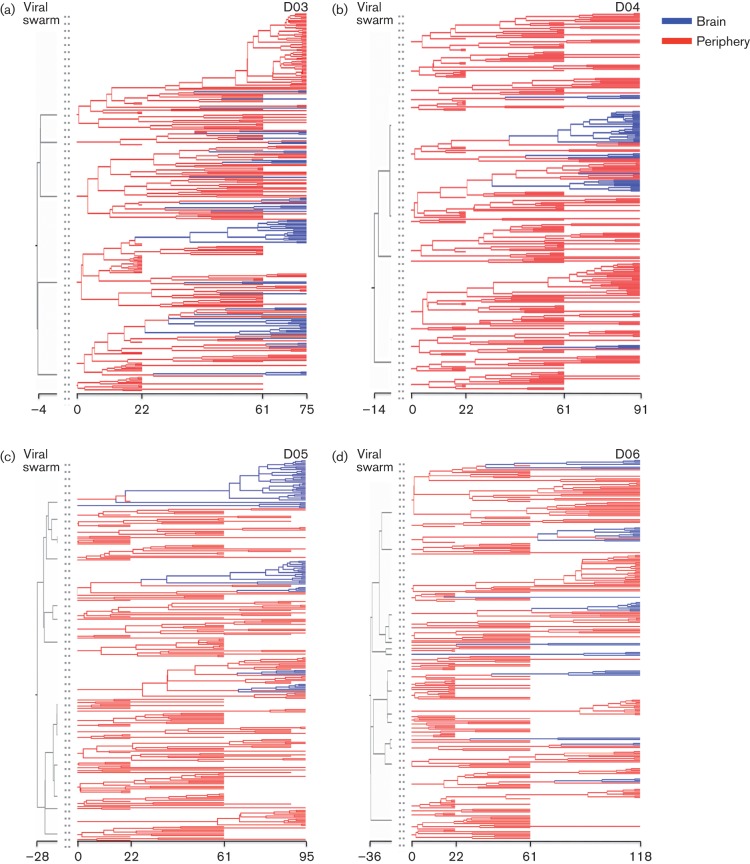
Fig. 2.
SIV gp120 Bayesian maximum clade credibility trees. The maximum clade credibility tree for each of the primates followed longitudinally (D03–D06) was estimated from the posterior distribution of trees obtained with a Bayesian coalescent framework enforcing a relaxed molecular clock. Branch lengths are scaled in time (days), and are coloured to represent peripheral (red) and brain (blue) tissues. Grey branches represent coalescent events of the viral swarm (pre-transmission interval) prior to inoculation. Viral migration events between the peripheral and brain tissues are represented as colour changes at individual nodes.

