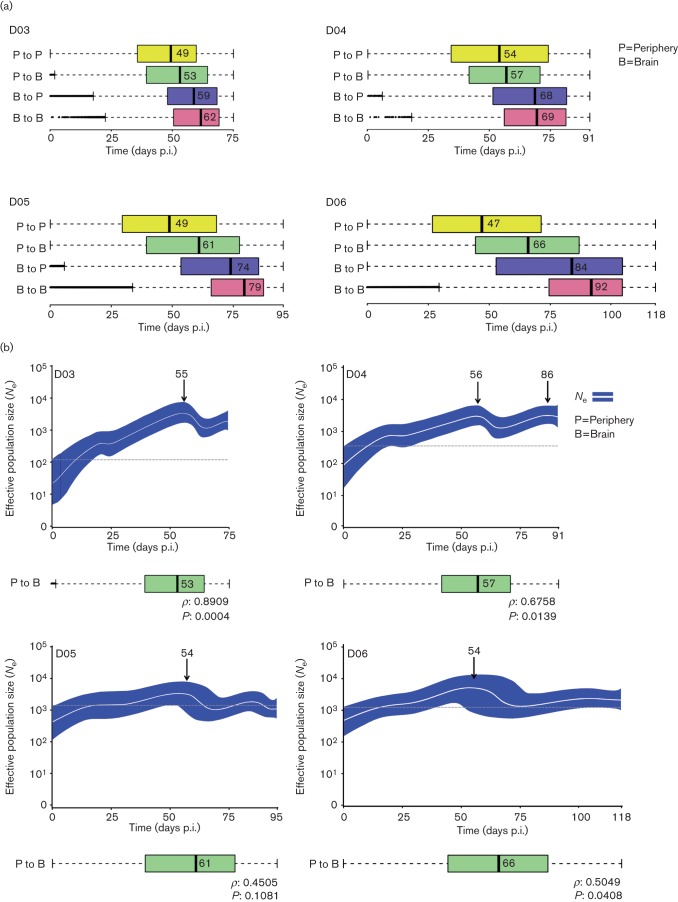
Fig. 3.
SIV phylogeographic and demographic patterns within primates followed longitudinally. (a) Viral gene flow (migration) events amongst different tissues within infected primates. Box plots represent the 95 % confidence intervals of the distribution of migration times, in days p.i., estimated by phylogeographic analysis. Broken lines represent outliers. Migrations within peripheral tissues (P to P) are displayed in yellow, from peripheral tissues to brain (P to B) in green, from brain to peripheral tissues (B to P) in blue and within brain tissues (B to B) in pink. Time intervals were inferred from a posterior distribution of trees obtained using a Bayesian coalescent framework enforcing a log-normal relaxed molecular clock with a Bayesian Skyride demographic prior and discrete phylogeographic parameter. The tissues are ordered according to the median migration time given by the number adjacent to the black vertical bar inside each box. (b) Bayesian Skyride plots with SIV migration times from peripheral tissues to the brain below. Bayesian Skyride plots show the change in Ne over time (days p.i.). The white line represents the median Ne with the surrounding blue area representing 95 % HPD intervals. Arrows indicate the time of the highest peak in Ne during the course of the infection. The dashed line highlights the fluctuations of Ne over time. Correlation between periphery to brain viral migration times and the Ne peak in the Skyride plots was analysed using Spearman’s rank order (correlation coefficient ρ and P value are given at the bottom of each plot).

