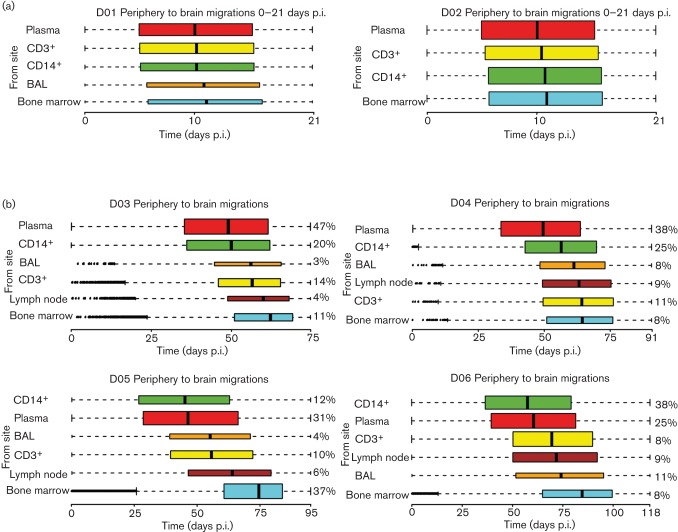
Fig. 4.
SIV gene flow events from peripheral tissues to the brain. Box plots show the 95 % confidence intervals of the distribution of migration times (days p.i.), estimated by phylogeographic analysis, from peripheral tissues to brain. Broken lines represent outliers. Time intervals were inferred from a posterior distribution of trees obtained with a Bayesian coalescent framework enforcing a relaxed molecular clock and a discrete phylogeographic parameter. The colour of the bar indicates a specific tissue or cell type: plasma (red), CD3+ T cells from peripheral blood (yellow), CD14+ monocytes from peripheral blood (green), BAL (orange), lymph nodes (brown) and bone marrow (cyan). The tissues are ordered according to the median time of brain entry (black vertical bar), with the earliest at the top and the latest at the bottom. The thickness of the bar is proportional to the percentage of the observed migrations (shown to the right of each bar for primates D03–D06). (a) Primates D01 and D02 euthanized at 21 days p.i. (b) Primates D04–D06 followed longitudinally until development of SIVE.

