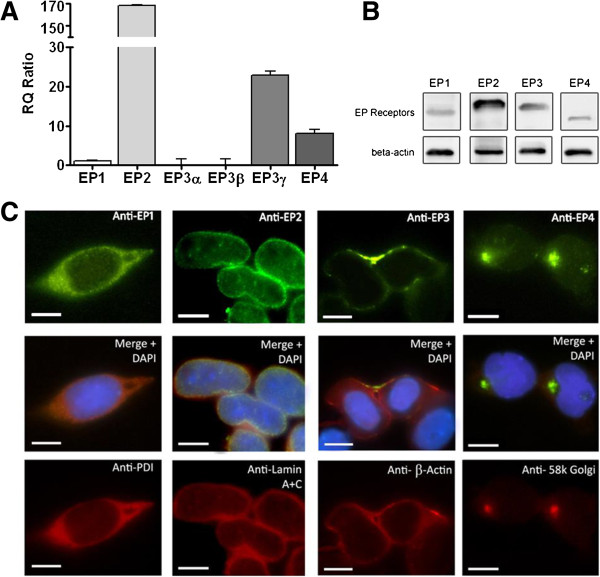
Figure 1.

Expression of EP receptors’ mRNA and protein in NE-4C cells. (A) Real-time PCR was used to determine the RQ value for EP1, EP2, EP3α, EP3β, EP3γ and EP4 receptors, which was found to be 2, 16, 1, 2, 46 and 46 respectively. The error bars represent + SEM. (B) Western blot analysis of the EP1, EP2, EP3 and EP4 receptors expression (65, 68, 62 and 53 kDa, respectively). β-Actin was used to indicate equal loading. (C) Immunocytochemistry revealed the subcellular localization of EP1-4 receptors with specific organelles visualized through the use of anti-PDI endoplasmic reticulum marker, anti-Lamin A + C nuclear envelope marker, β-Actin cell membrane marker, and anti-58 K Golgi marker. The scale bar represents 10 μm.
