
Figure 3.
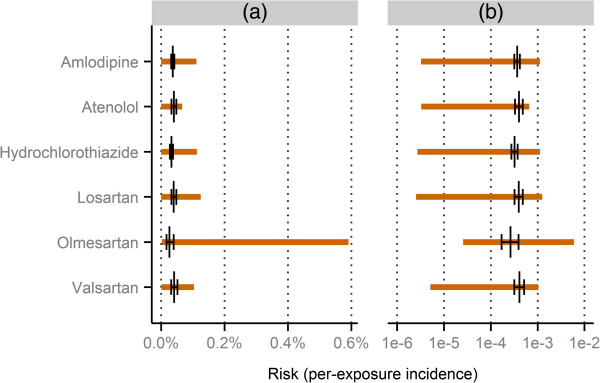
Computed limits and reference values for the risk of coeliac disease following use of antihypertensive treatment. The horizontal orange lines indicate the intervals computed as , and the black vertical lines indicate the reference point estimates with their corresponding 99% confidence intervals. Panel (a) shows the values untransformed, whereas panel (b) uses a logarithmic scale. All risks refer to the US population between 1st January 2007 and 31st December 2011. All underlying data is presented in Table 3.