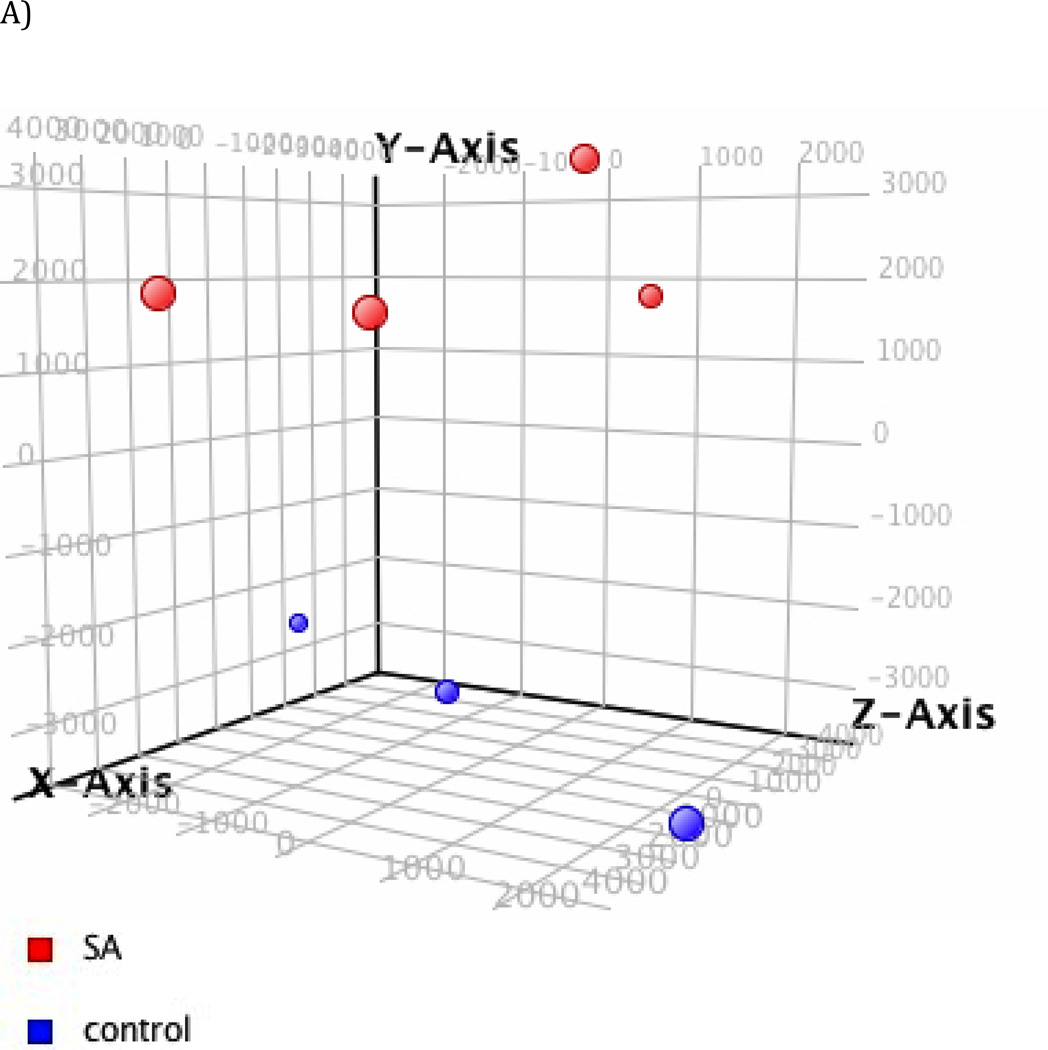
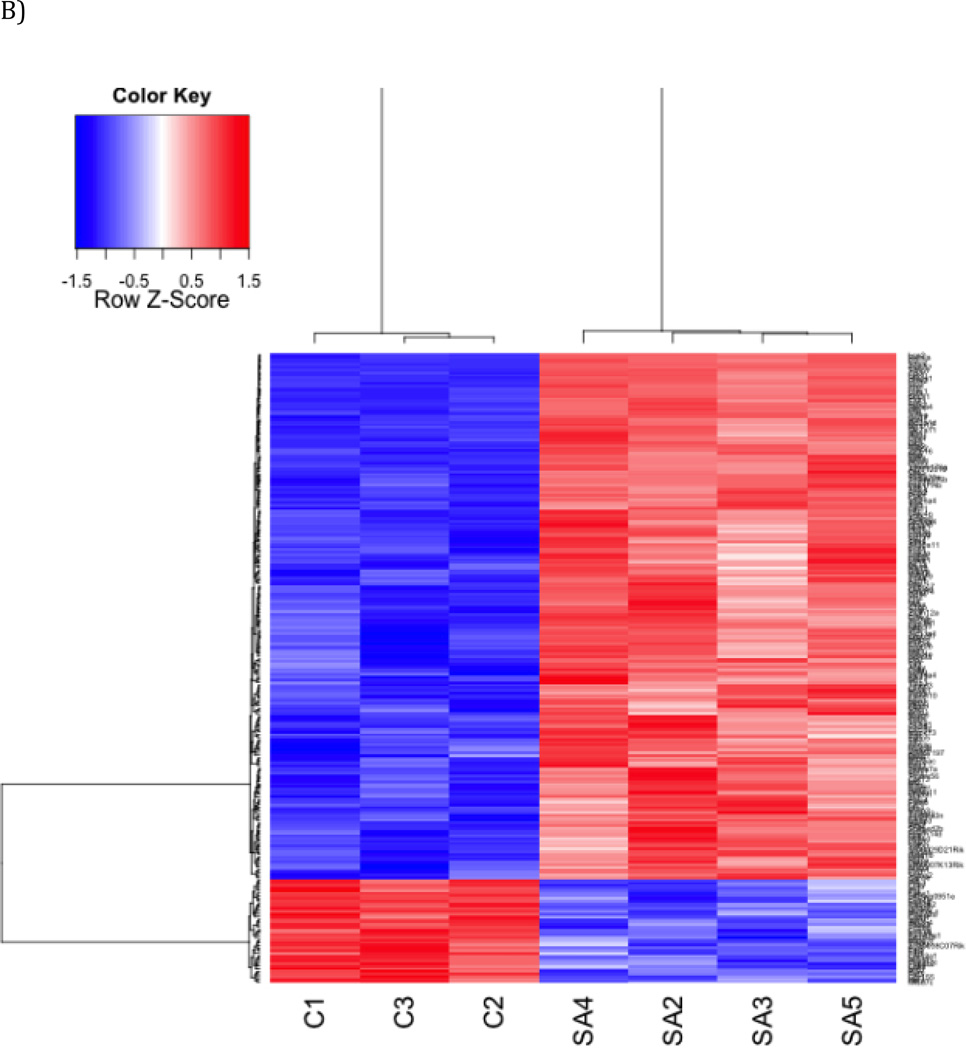
Fig. 2. Gene expression profiles of PM10-exposed mice.
(a) Principal component analysis (PCA) PCA revealed distinct separation between control mice vs. treatment mice Red: PM10; Blue: control (b) Heat Map. Hierarchical cluster analysis of significantly differentially expressed genes in a PM10- treated group compared to an untreated control group. The bar relates the color code to the expression value after quantile normalization and baseline transformation to the median levels of control samples.


