Figure 3.

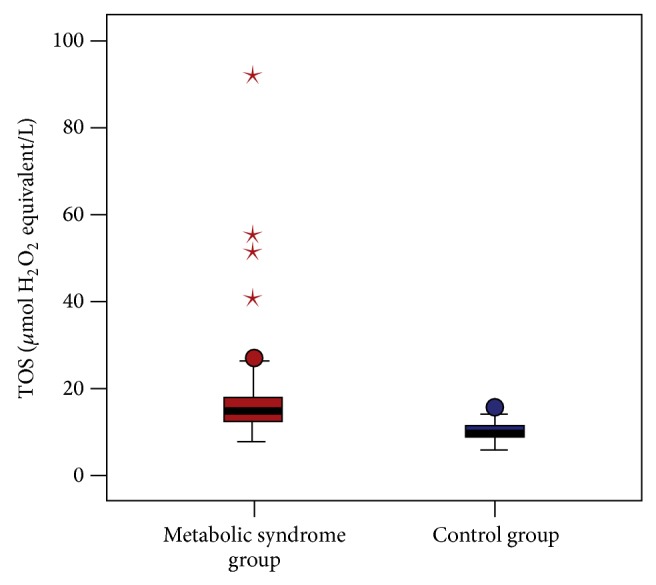
Comparison of serum TOS levels of patients with metabolic syndrome and the control group (17.3 ± 10.6 μmol H2O2 equivalent/L and 10.4 ± 2.0 μmol H2O2 equivalent/L, resp.; P < 0.001).

Comparison of serum TOS levels of patients with metabolic syndrome and the control group (17.3 ± 10.6 μmol H2O2 equivalent/L and 10.4 ± 2.0 μmol H2O2 equivalent/L, resp.; P < 0.001).