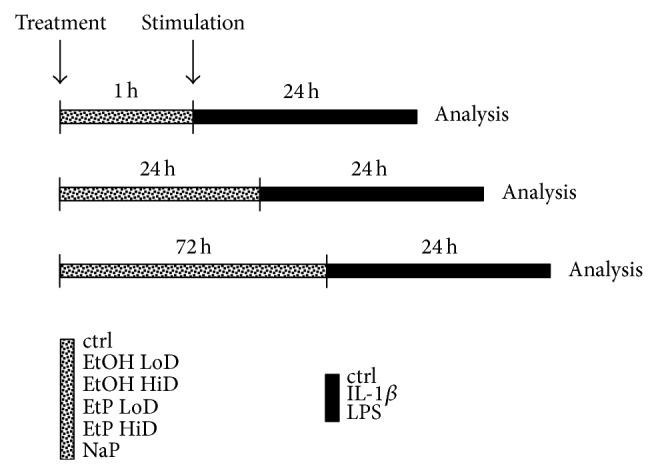
Figure 4.

Schematic timeline of the experimental design. Cells were treated with EtOH (low dose, LoD = 85 mM and high dose, HiD = 170 mM), EtP (LoD = 2.5 mM and HiD = 10 mM), or NaP (10 mM) for 1 h, 24 h, or 72 h and then stimulated with IL-1beta (1 ng/mL) or LPS (1 μg/mL) for 24 h. After the incubation periods, the analyses were performed.
