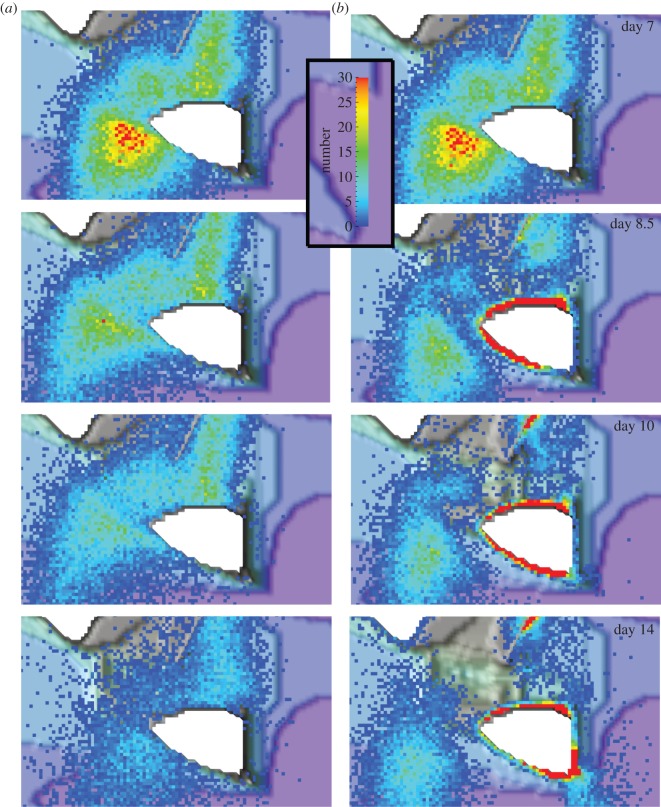
Figure 3.
The predicted synoptic distribution of (a) the larval plume around OTI for scenario 2 (non-swimming larvae) and (b) for scenario 4 (swimming larvae) on days 7, 8.5, 10 and 14 after spawning at sites A and B (shown in figure 1). The scale bar is in number of larvae per cell (200 × 200 m). Larval mortality was not included in this model, i.e. the model only follows living larvae.

