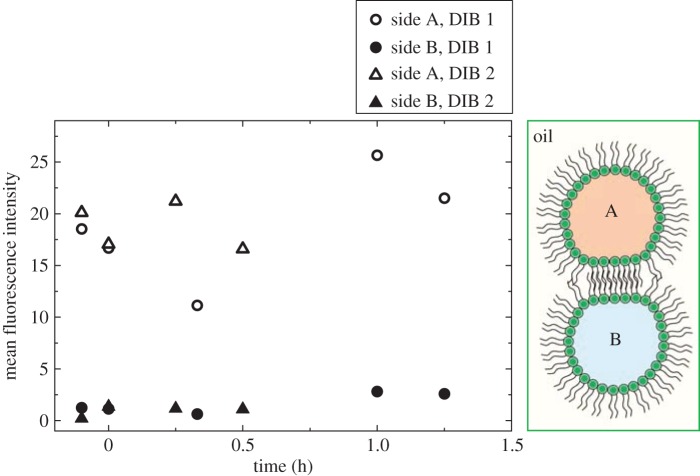
Figure 3.
Control plot showing fluorescence changes in the DIB droplets where DIB 1 contains MTSET but no MscL and DIB 2 contains MscL but no MTSET. Neither DIB shows any fluorescence change in side A or B, where side A is calcein loaded (0.5 mM) and side B is sucrose loaded. (Online version in colour.)

