Figure 1.
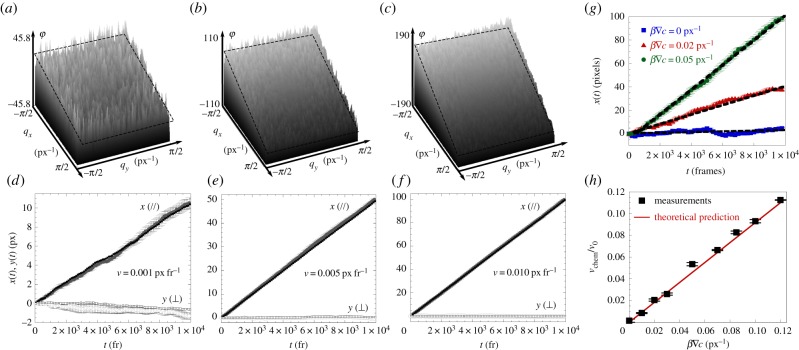
Simulations demonstrating the ability of φDM to measure drifts. (a–c) The phases φ(q; t) for the last frame (trec = 104 fr) in simulations of drifting and diffusing particles (D = 5 × 10 −3 px2 fr−1), for input velocities as indicated in (d), (e) and (f), respectively. These phases are the superpositions of tilted planes (emphasized by the dotted planes) resulting from the drift, and a random component coming from Brownian motion. (d–f) The drift in the centre of mass, found from the raw simulation data (black) and from our image analysis method (grey). Its x and y components are shown by closed and open symbols, respectively. The error bars indicate uncertainties as described in the main text; broadly speaking, the accuracy is within a pixel after 104 frames. (g) Measured trajectories of the centre of mass of the simulated bacteria for several chemoattraction strengths. The simulation parameters are chosen to resemble our experiments. A chemotactic velocity is measured from these trajectories (dotted lines). (h) This velocity is a linear function of the normalized gradient β∇c for small gradients and is in excellent agreement with the prediction for the class of models for chemotaxis we used (red line). Chemotactic velocities as low as 50 nm s−1 (0.3% of the bacterial swimming speed) can be measured.

