
Figure 4.
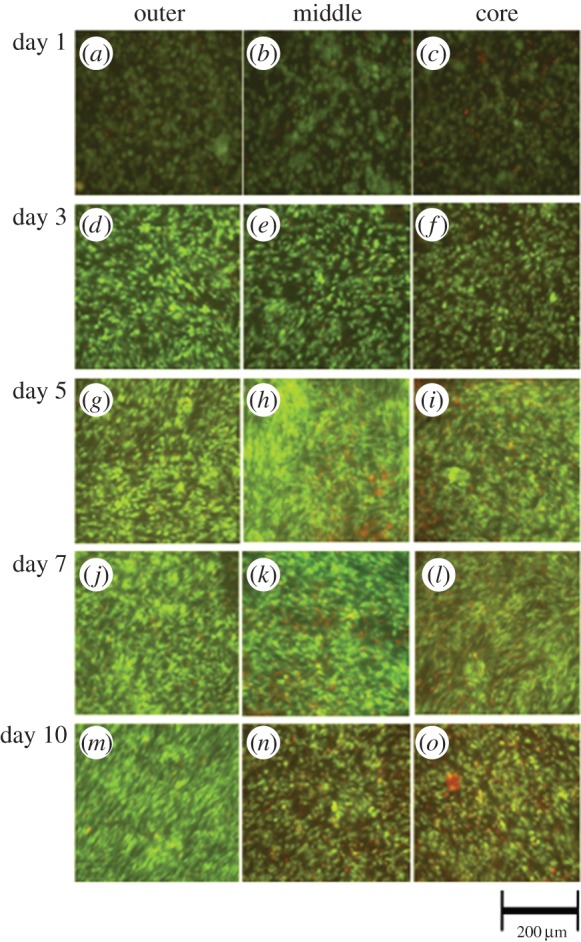
Confocal images of the outer, middle and core regions at days 1, 3, 5, 7, 10 after live/dead staining. Images show spatial and temporal variations in cellular viability and support the data presented in figure 3.
Official websites use .gov
A
.gov website belongs to an official
government organization in the United States.
Secure .gov websites use HTTPS
A lock (
) or https:// means you've safely
connected to the .gov website. Share sensitive
information only on official, secure websites.
Confocal images of the outer, middle and core regions at days 1, 3, 5, 7, 10 after live/dead staining. Images show spatial and temporal variations in cellular viability and support the data presented in figure 3.