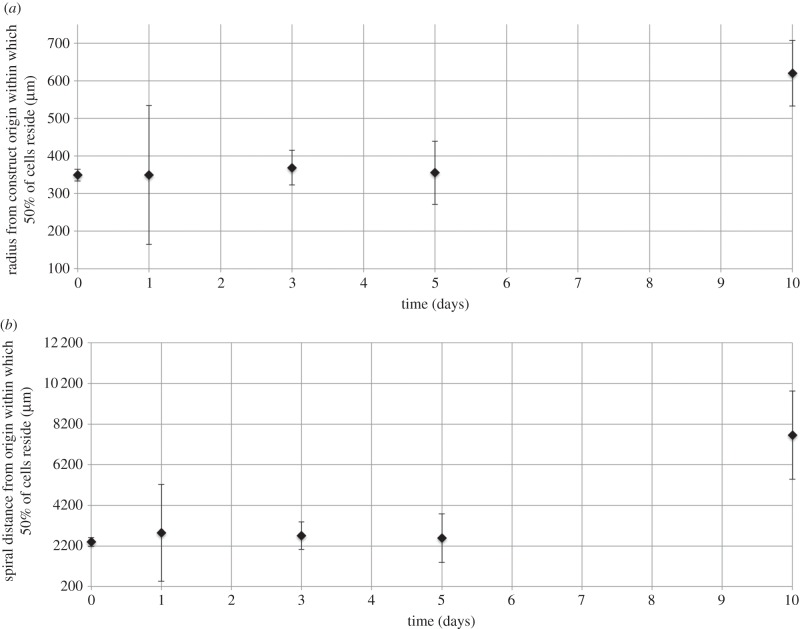
Figure 6.
Distance from the origin within which 50% of cells that originated in the core region reside, measured either radially (a) or along the spiral centreline (b) from the construct origin. Cells placed in the core of the spiralled construct were labelled with nucleic acid stain, and stain intensity (which is proportional to cell density) tracked at subsequent time points. Cumulative intensity data were normalized to calculate the probability of a cell residing within a fixed distance from the construct origin, measured either radially or round the spiral centreline (figure 2). Data are based on three to five independent experiments/repeats. Includes error bars for standard error.

