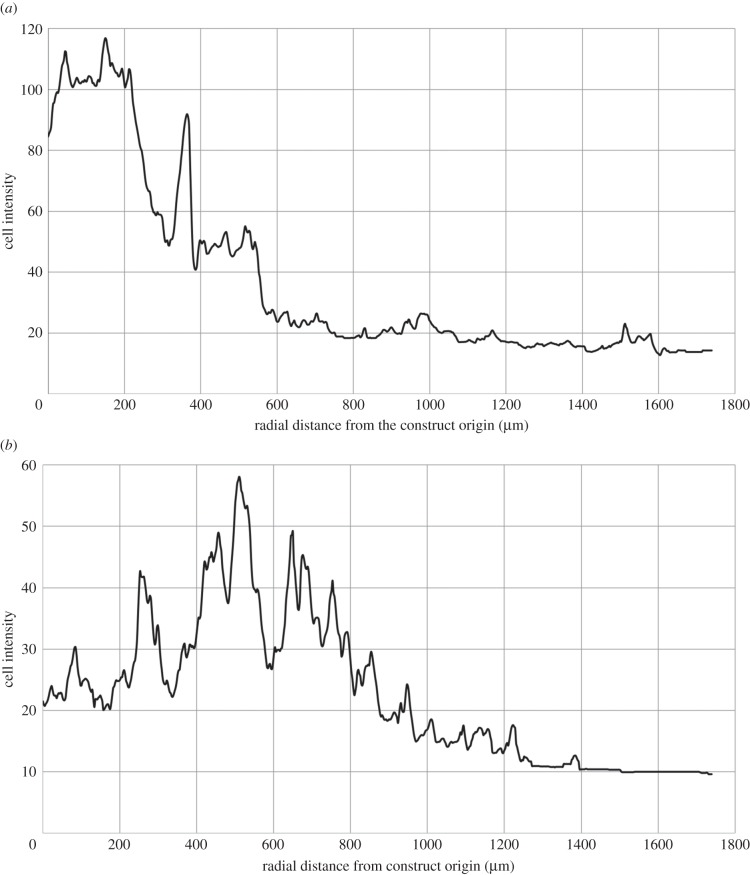
Figure 7.
Change in cell intensity distribution at day 5 (a) and day 10 (b) for fluorescently labelled cells originating in the construct core (cell intensity is proportional to cell density). Net migration from a mean radial position of 355–620 μm is apparent over the 5-day time period. A periodic pattern of peaks and troughs is apparent, and has period approximately equal to the thickness of the collagen sheet (80 μm).

