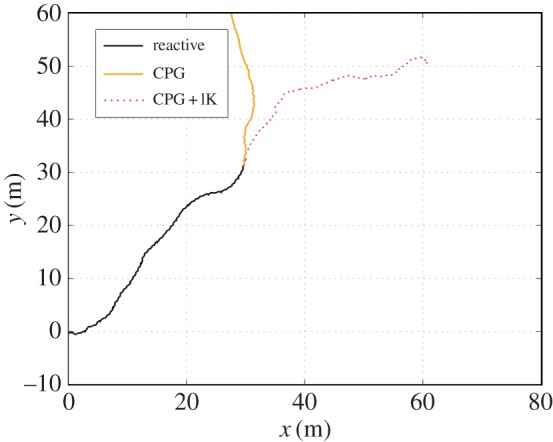
Figure 11.

Trajectory of the tensegrity (top view). The dark curve represents the trajectory while the robot is driven by the reactive control algorithm and the CPG is in the learning mode (50 s). Motion is regular and the heading is maintained throughout the entire period. Light solid (yellow) and dashed (red) trajectories represent the path travelled once the CPG controller takes over (40 s). When the CPG is coupled to the height signal and receives inputs from the second-order inverse kinematics algorithm (dashed red curve), the resulting trajectory is a long and relatively straight line extending well the reactive control. (Online version in colour.)
