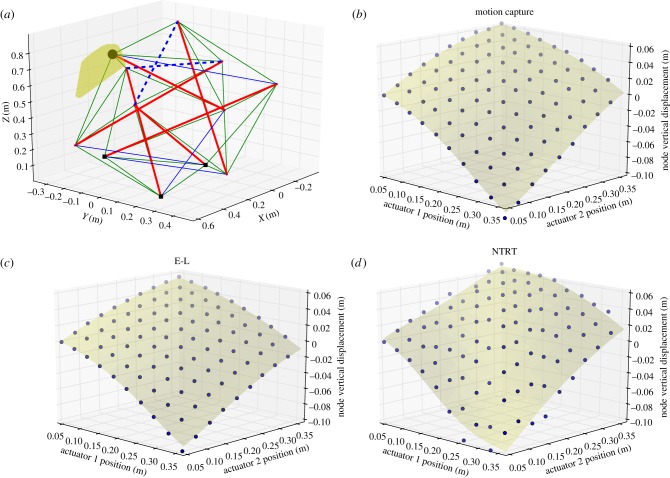
Figure 6.
(a–d) Kinematic comparison of Euler–Lagrange (E-L) and NTRT simulators and ReCTeR motion capture data. (a) shows the experimental set-up. The rest length of two actuated spring–cable assemblies (dashed lines) is modified. The full range of tracked end-cap motion during the experiment is shown in transparent yellow (convex hull). The end caps indicated by small squares are on the ground. (b–d) show vertical displacement of the end cap indicated by the large black dot in (a) as a function of the lengths of the two actuated cables. The end cap where we trace the displacement is not directly actuated and is floating. The nodal displacement as a function of the actuator position is nonlinear, even for modest displacements. Note that the left-most point (0.05, 0.05, 0) is the reference point; displacements are relative to this initial state. (Online version in colour.)

