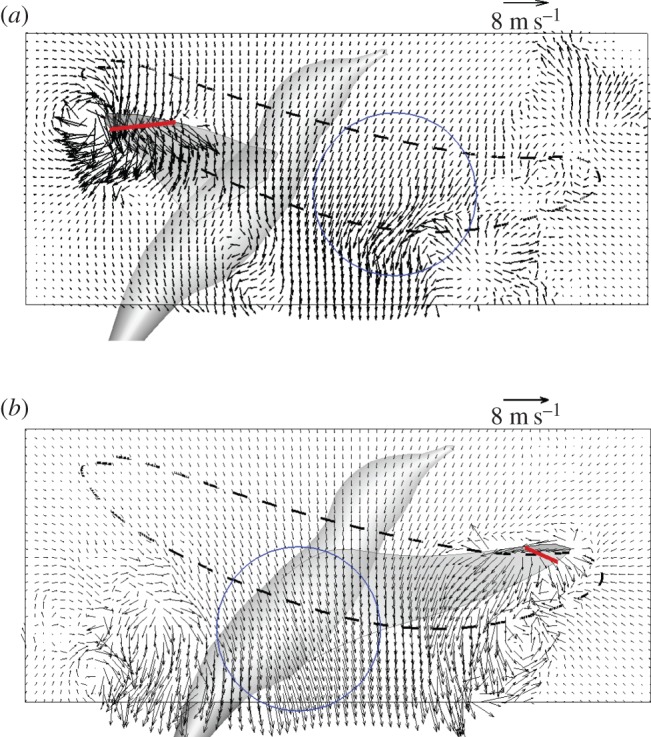
Figure 10.

Typical asymmetric wing–wake interaction shown in a spanwise slice for (a) an early downstroke at Y = 70% wingspan and t/T = 0.1, and (b) an early upstroke at Y = 50% wingspan and t/T = 0.6. The dashed line indicates the tip trajectory of this cycle, and the circle indicates the opposite flow caused by the preceding half stroke. The chord is shown as a thick line. The bird body was not included in the actual single-wing simulation. (Online version in colour.)
