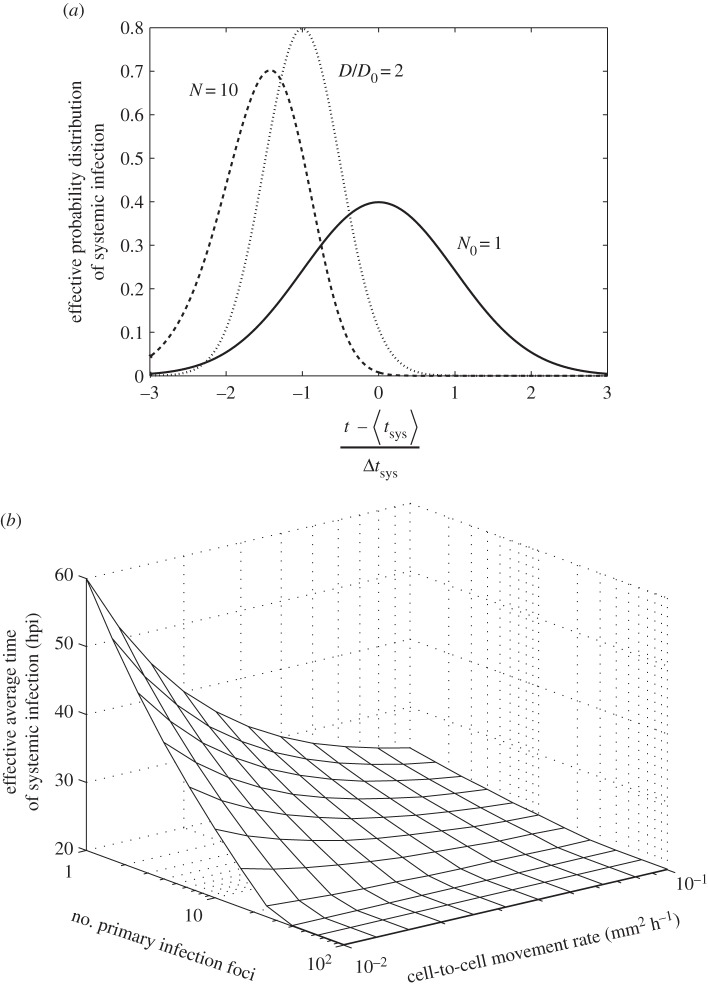
Figure 4.
Model predictions with the number of primary infection foci (N) and the cell-to-cell movement rate estimated as the effective diffusion coefficient (D) as variables. (a) Calculations with equation (2.9) of the effective probability distribution of systemic infection ((d/dt)Psys(t)N) for a reference system (solid line, variables with subscript 0), and when N = 10 (dashed line) and when D is duplicated (dotted line). (b) Model prediction of the effective average time of systemic infection ( ) as a function of N and D (equation (2.10)). For this plot, we used μ = 0.40 mm2, σ = 0.20 mm2 and T = 20 hpi.

