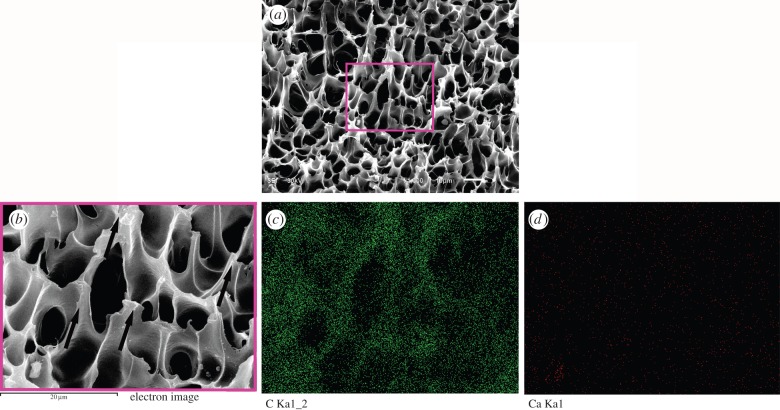
Figure 3.
SEM photographs and EDS map-scanning analysis of the fracture surface after bonding test: fracture surface of the sample (a); higher magnification corresponding to the rectangle in (a), and the arrows denote the direction of shear force; map-scanning analysis of C element (c) and Ca element (d) corresponding to (b). (Online version in colour.)

