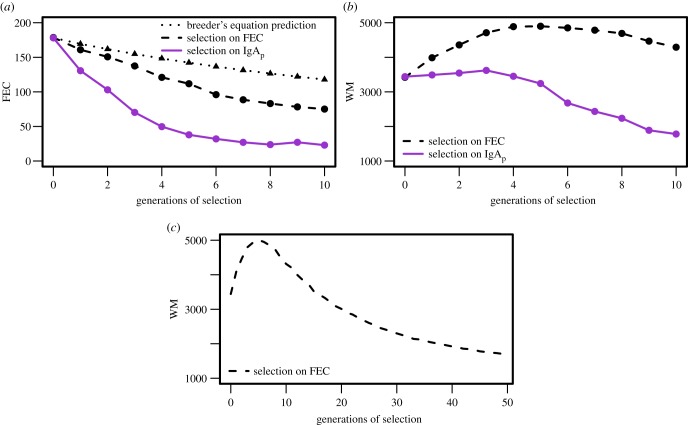
Figure 4.
(a) Mean flock faecal egg count (FEC) at the end of the grazing season over 10 generations of selection. The dotted line is the predicted response using the breeder's equation; the dashed dark line shows the response to selection based on low FECs; the solid light line shows the response to selection based on high plasma IgA activity. (b) Mean flock worm biomass (WM) at the end of the grazing season over 10 generations of selection: selection based on low FEC in dashed dark; selection based on high plasma IgA activity in solid light. (c) Average flock WM at the end of the season for 50 generations of selection on low FEC. (Online version in colour.)

