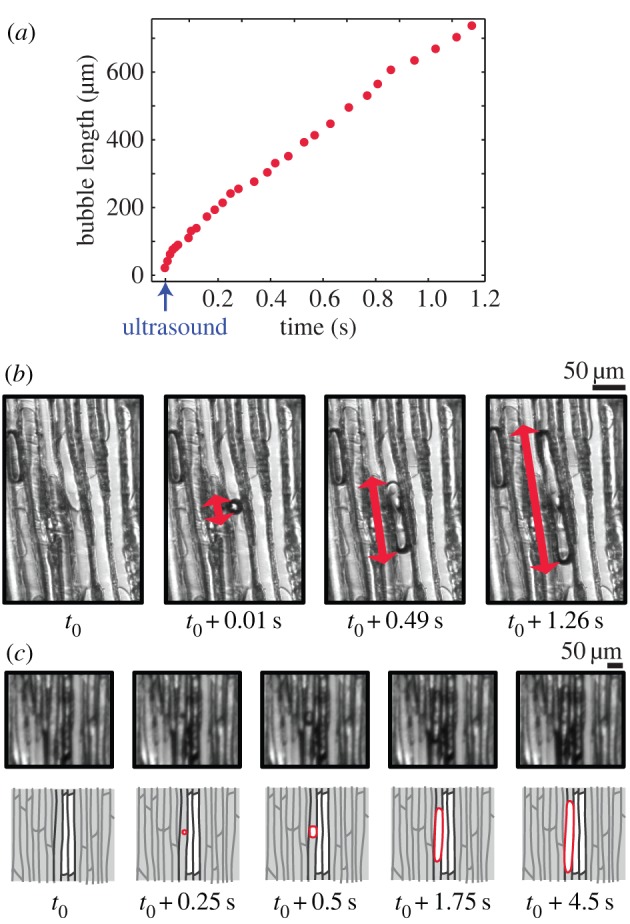
Figure 3.

(a) Bubble length as a function of time (red symbols, measured on some selected images). The timing of the detected sound is indicated with the blue arrow. (b) Nucleation of a bubble in a conduit, recorded with a high-speed camera (1000 frames per second). The red line indicates the bubble length. (c) Air-seeding event, when a bubble nucleates near an already cavitated conduit, recorded with a 4 Hz camera. The evolution is sketched below each image, to increase the readability.
