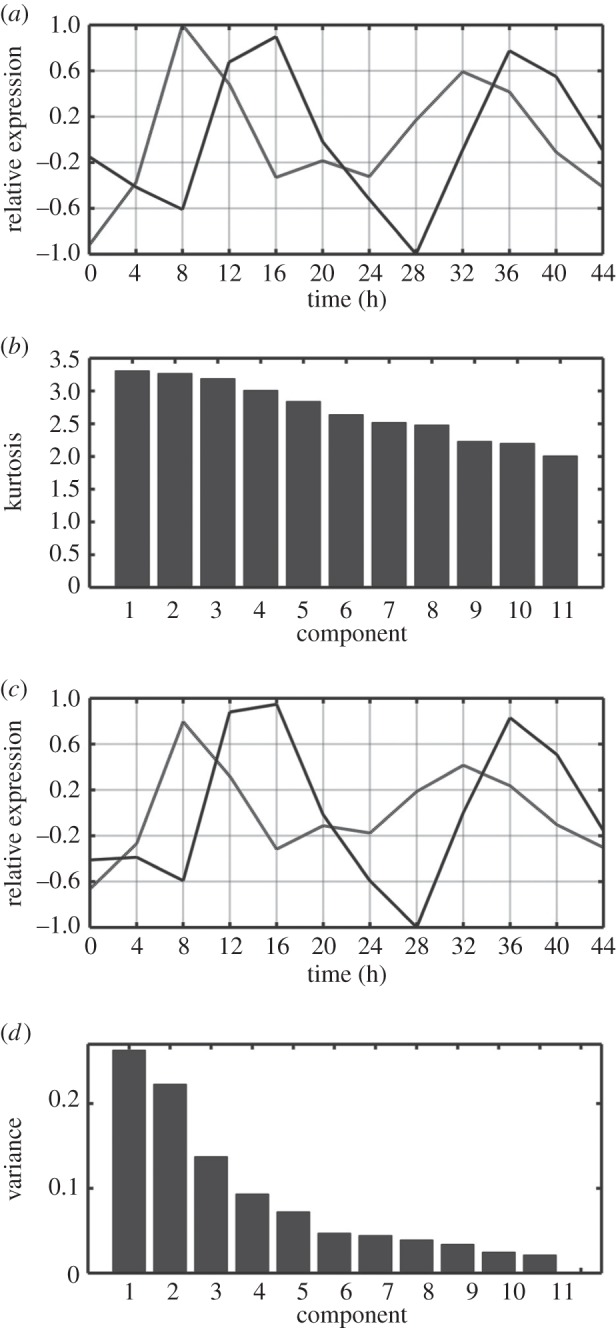
Figure 1.

ICA and PCA performed on Arabidopsis circadian microarray time series. (a) First (peak at 8 h) and second (peak at 12–16 h) independent components plotted against time since subjective dawn. (a) The kurtosis of a frequency distribution of data projected along each independent component. (c) First (peak at 8 h) and second (peak at 12–16 h) principal components. (d) Variance within the data captured by each principal component.
