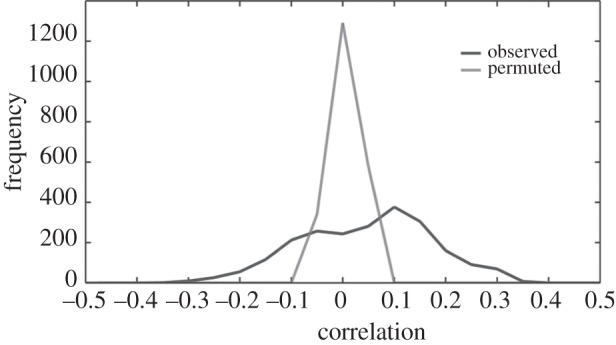
Figure 5.

Integrative correlation coefficient between species. Distribution of the correlation coefficient between Arabidopsis and Oryza sativa orthologous circadian genes. The orthologous circadian genes show significantly higher integrative correlations using actual observed data (black line) than the null distribution, which was generated using permuted data where gene expression values within each gene were randomized (grey line).
