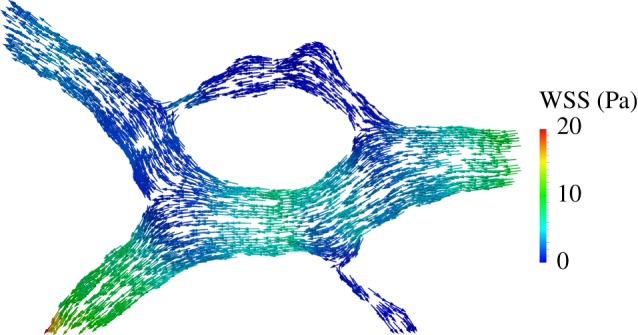
Figure 10.

Traction vectors (of constant length and coloured according to magnitude) on the luminal surface of the region of interest highlighted in figure 9b. The loop branch undergoing regression (upper branch) experiences a much lower traction magnitude.
