
Figure 11.
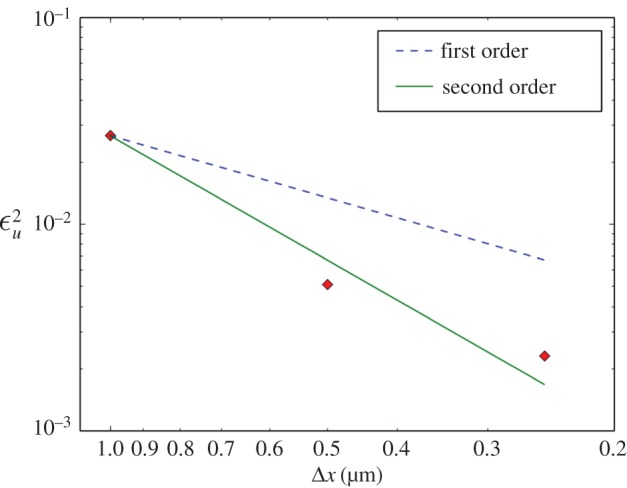
Velocity error residual  on simulations with the P6A flow model discretized with Δxi = 1.0, 0.5 and 0.25 μm (diamond-shaped markers). In order to keep the analysis computationally tractable,
  is computed with results obtained at the lattice sites located on the z = 0 plane only (this is the same subset of the results presented in figure 9). The lines are guides to the eye showing first-order (dashed) and second-order (solid) convergence. (Online version in colour.)