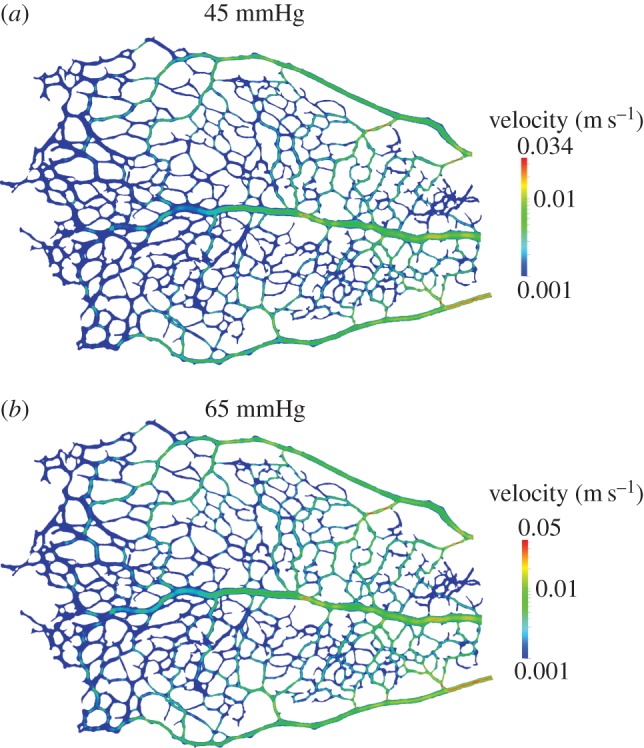
Figure 12.

Simulation results: velocity magnitude plotted on a cross section along the z = 0 plane for OPP values of 45 and 65 mmHg. The logarithmic colour scales have been adjusted to range from 1 mm s−1 to the largest velocity in the domain. Branches of predominant flow and velocity gradients remain fairly constant despite moderate changes in OPP when compared with figure 9a.
