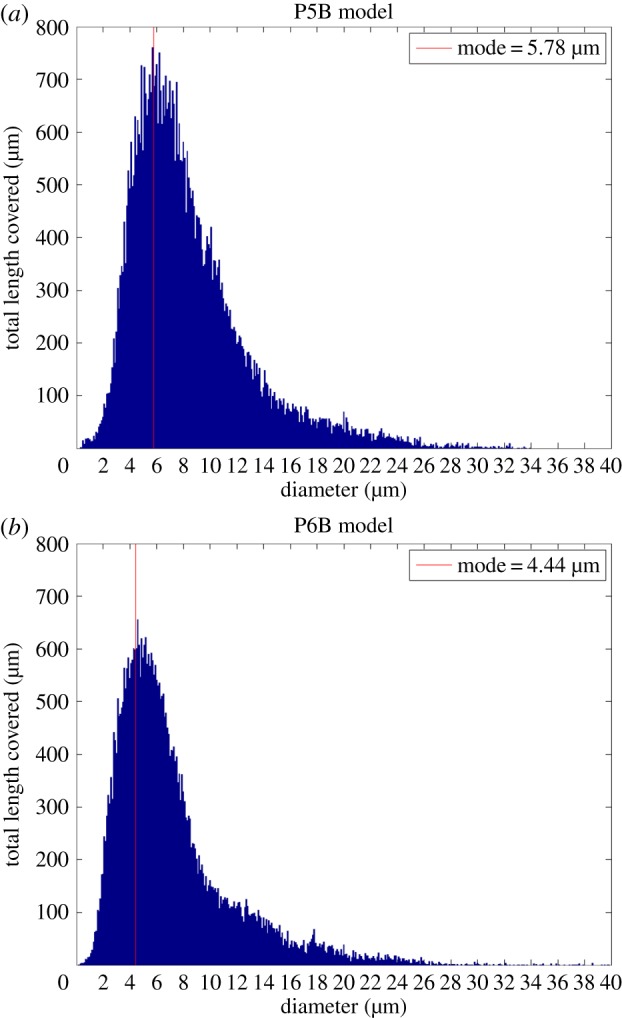
Figure 7.

Network diameter histogram showing the aggregated total distance covered by vessels of a given diameter. Vertical lines indicate the mode of a lognormal probability distribution fit of each dataset. The values for the models not shown here are 5.51 μm (P5A) and 5.29 μm (P6A). We use these values as an estimate of the typical capillary diameter (the most common type of vessel in the network). Capillaries with diameter approaching 0 μm appear to be undergoing remodelling. Arterial and venular segments present higher diameters ranging up to 34 and 40 μm, respectively. (Online version in colour.)
