
Figure 4.
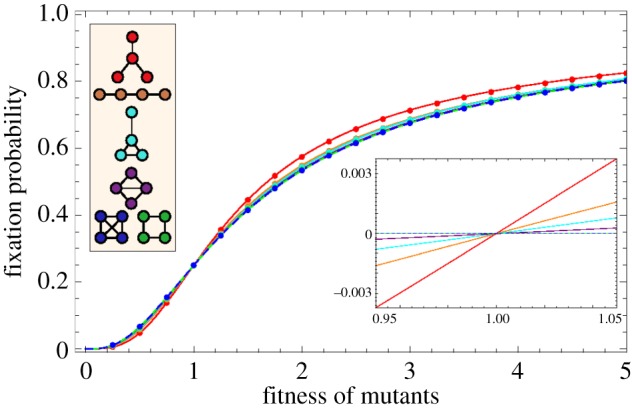
Fixation probability for the six structures of size four. Lines show analytical results, whereas every dot represents the frequency of fixations (in state N) out of total number of absorptions (either in state 0 or N) over 106 independent realizations of the process. The networks in the legend are drawn in the same colour as the respective fixation probability. The inset shows a zoom into the region 0.95 < r < 1.05, where the fixation probabilities are plotted as differences to the well-mixed case. (Online version in colour.)