
Figure 5.
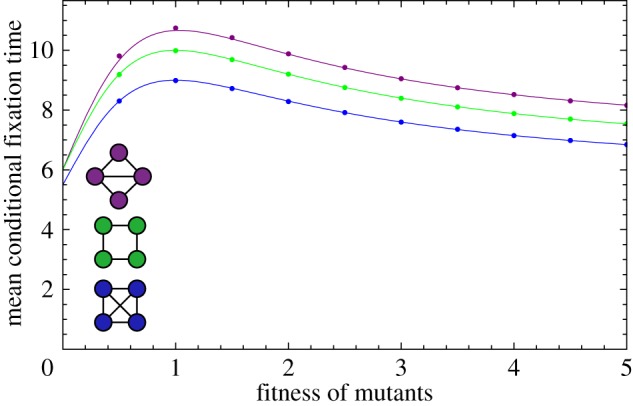
The expected conditional fixation time τ1,N on three networks of size four. Lines represent the analytical result and each dot is the average over 106 independent realizations. (Online version in colour.)
Official websites use .gov
A
.gov website belongs to an official
government organization in the United States.
Secure .gov websites use HTTPS
A lock (
) or https:// means you've safely
connected to the .gov website. Share sensitive
information only on official, secure websites.
The expected conditional fixation time τ1,N on three networks of size four. Lines represent the analytical result and each dot is the average over 106 independent realizations. (Online version in colour.)