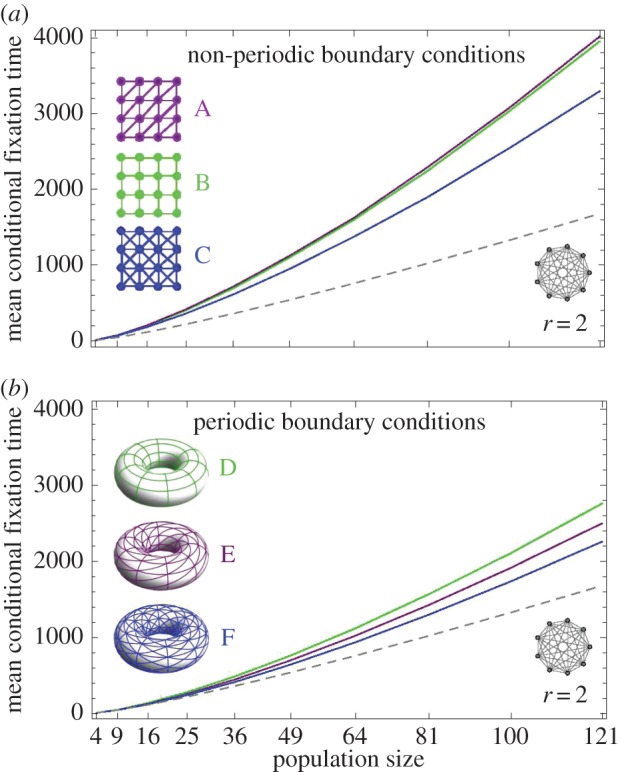
Figure 9.

The simulated mean conditional fixation time on three different lattice networks for population sizes 4, 9,…, 100, 121 and mutant fitness r = 2. On both panels, the dashed line depicts the mean conditional fixation time on the complete network of the respective size. Panel (a) shows the fixation time on the lattices without periodic boundary conditions, as they are exemplarily depicted in the legend for size 16. For the fixation time shown in panel (b), the boundaries of each lattice are connected, such that the structure can be illustrated on the surface of a torus. (Online version in colour.)
