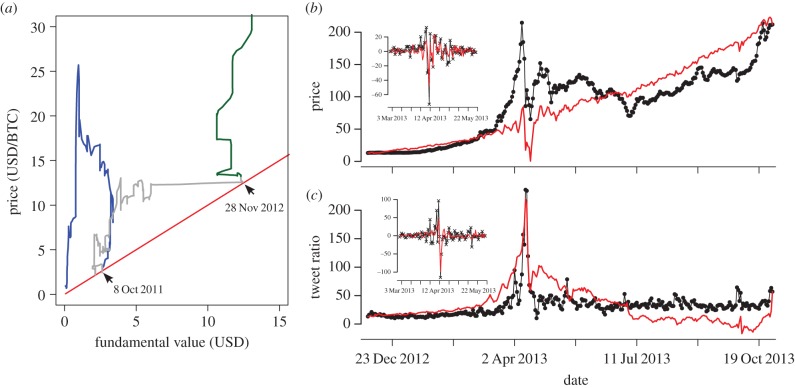
Figure 3.
(a) Trajectory of weighted mean price and mean fundamental value over weekly rolling windows between 1 Mar 2011 and 1 Mar 2013. The red line denotes strict equality between price and fundamental value. Blue dots show values before the first hitting event (18 Oct 2011), green dots show the values after the last hitting event (30 Nov 2012) and grey dots show the period in between. (b,c) Time series of the cumulative price and tweet ratio (black dots), and cumulative estimated values by the model for the period since 30 Nov 2012. Insets: time series of estimates and empirical changes of price and tweet ratio for the period between 1 Mar and 30 May 2013. (Online version in colour.)

