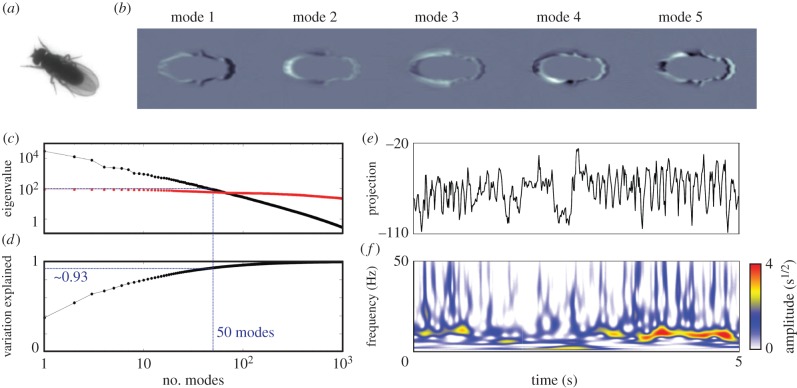
Figure 3.
Generation of spectral feature vectors. (a) Raw image of a fly in the arena. (b) Pictorial representation of the first five postural modes,  , after inverse Radon transform. Black and white regions represent highlighted areas of each mode (with opposite sign). (c) First 1000 eigenvalues of the data matrix (black) and shuffled data (red). (d) Fraction of cumulative variation explained as a function of the number of modes included. (e) Typical time series of the projection along postural mode 6 and (f) its corresponding wavelet transform.

