
Figure 10.
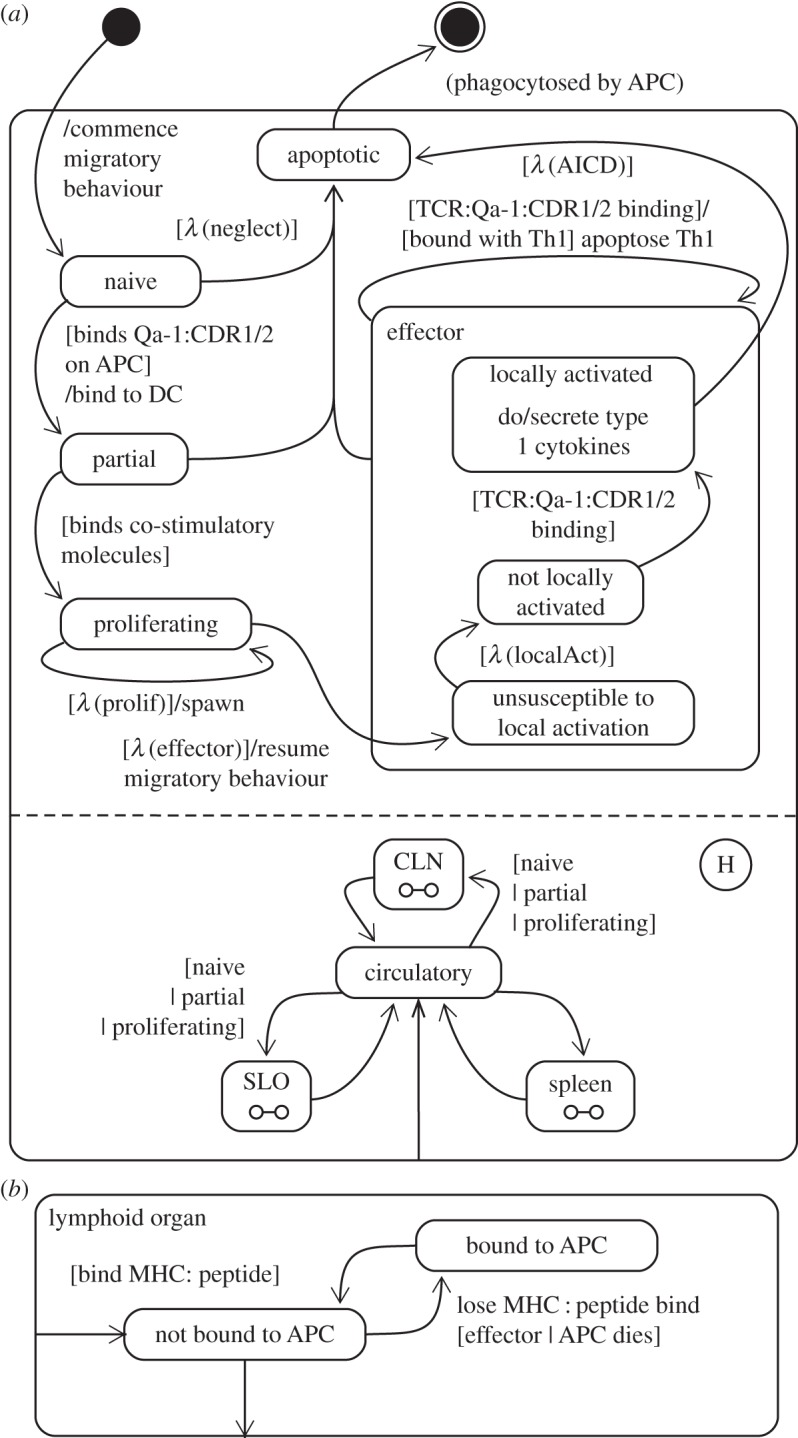
(a) State machine diagram depicting the dynamics of CD8Treg cells. (b) Decomposition of the lymphoid organ states: the SLO, CLN and spleen. Adapted from [4].
Official websites use .gov
A
.gov website belongs to an official
government organization in the United States.
Secure .gov websites use HTTPS
A lock (
) or https:// means you've safely
connected to the .gov website. Share sensitive
information only on official, secure websites.
(a) State machine diagram depicting the dynamics of CD8Treg cells. (b) Decomposition of the lymphoid organ states: the SLO, CLN and spleen. Adapted from [4].