
Figure 12.
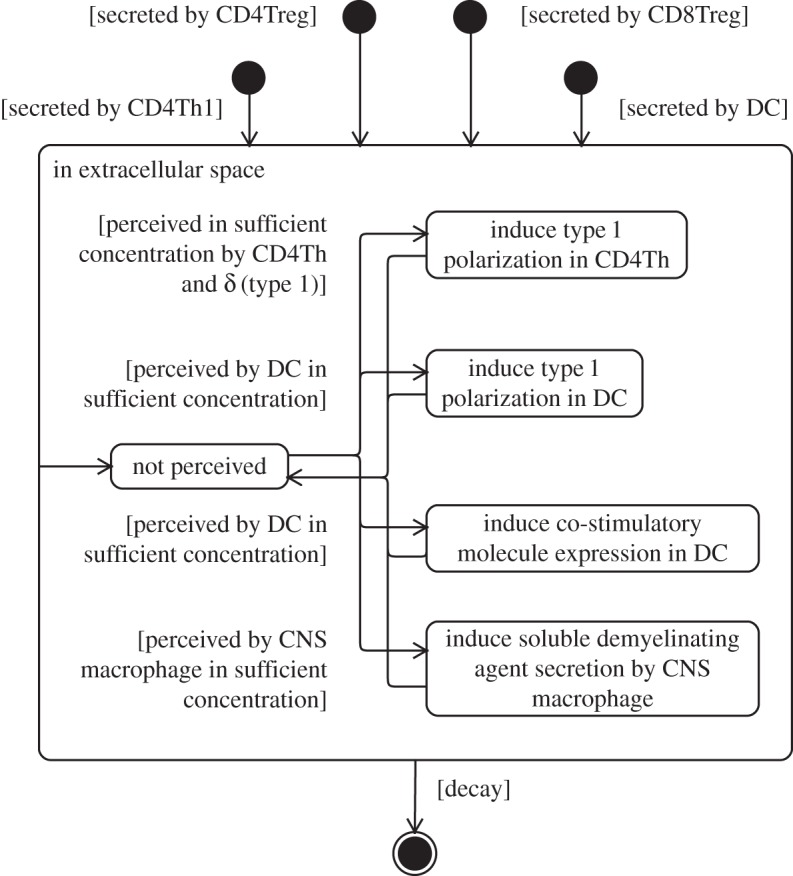
State machine diagram depicting the dynamics of a soluble signalling molecule (type 1 cytokine), and its influence on other cells of the domain model. Adapted from [4].
Official websites use .gov
A
.gov website belongs to an official
government organization in the United States.
Secure .gov websites use HTTPS
A lock (
) or https:// means you've safely
connected to the .gov website. Share sensitive
information only on official, secure websites.
State machine diagram depicting the dynamics of a soluble signalling molecule (type 1 cytokine), and its influence on other cells of the domain model. Adapted from [4].