Figure 6.

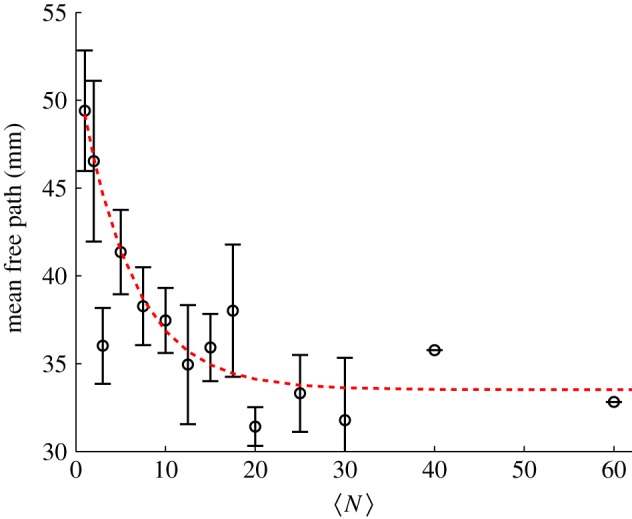
Mean free path between high-curvature events as a function of the number of individuals in the swarm. The dashed line is an exponential fit with N0 = 5.8 ± 2.2. (Online version in colour.)

Mean free path between high-curvature events as a function of the number of individuals in the swarm. The dashed line is an exponential fit with N0 = 5.8 ± 2.2. (Online version in colour.)