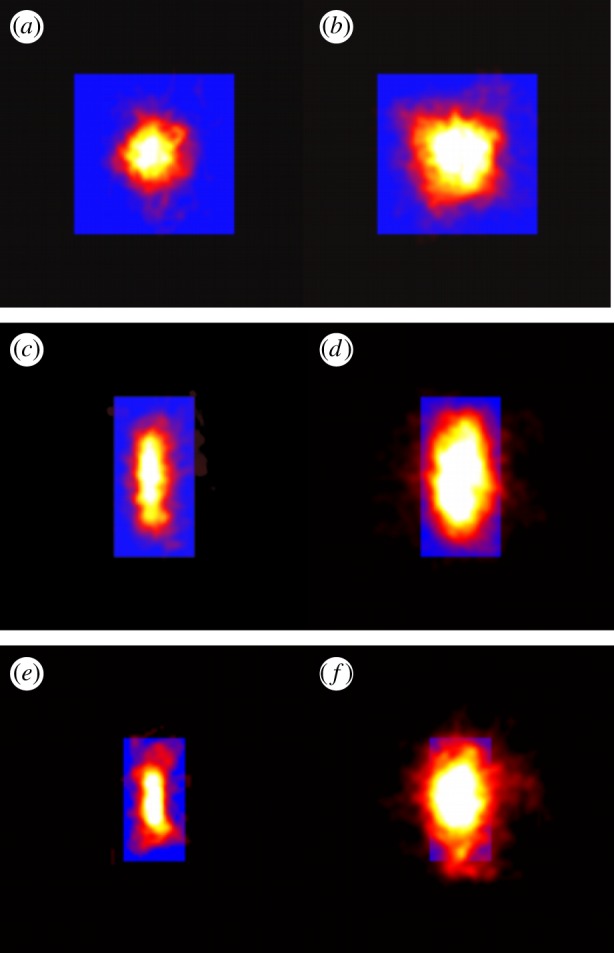
Figure 7.

Heat maps showing the likelihood of finding a midge for (a,b) a 32 × 32 cm swarm marker, (c,d) a 16 × 32 cm marker and (e,f) a 12 × 24 cm marker, all as viewed from above, for swarms of (a)  , (b)
, (b)  , (c)
, (c)  , (d)
, (d)  , (e)
, (e)  and (f)
  . The markers are shown as solid-colour rectangles. For small swarms (left column), the swarm shape tracks the shape of the marker, but for larger swarms (right column), the swarms are more isotropic. (Online version in colour.)
