
Figure 3.
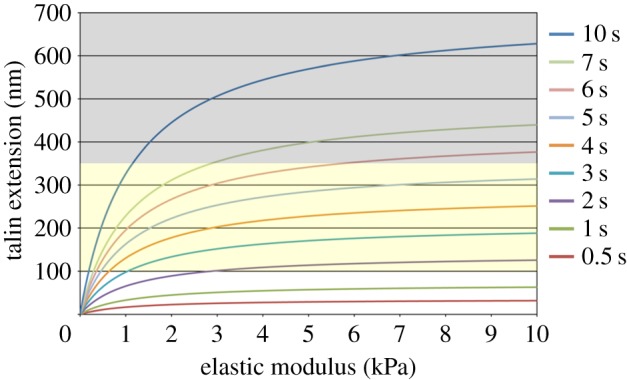
Influence of the lifetime of talin links on the stiffness-dependent talin extension. Each trace represents extension of talin links at the end of their lifetime. The order of traces is the same as that of legends. The results for the focal complex (500 nm in diameter) containing 30 talin links are shown. In each trace, the length of talin extension is increased to the plateau value (=vτ) with increasing stiffness of the substrate. The yellow zone (100 nm ≤ Δl ≤ 350 nm) represents the range where talin links are extended to allow vinculin binding, and the grey zone (Δl > 350 nm) represents the range where they are extended beyond the level observed in living cells. (Online version in colour.)