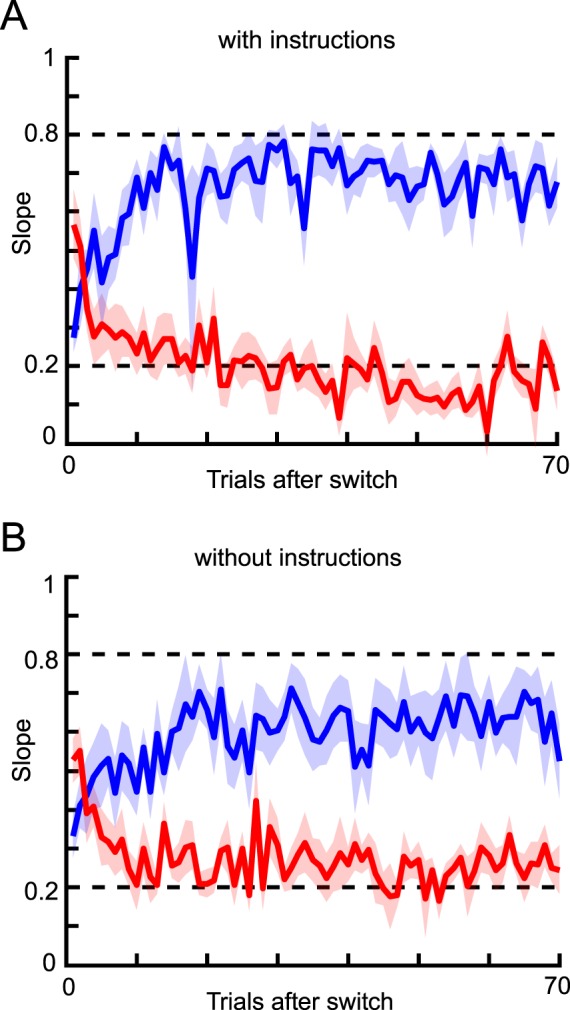
Figure 3.

Mean slope after each switch. (A) Results for the subjects who received instructions regarding changes in likelihood width. Blue and red lines show the results for the narrow and wide conditions, respectively. The shaded area indicates the standard error across subjects. Each slope was calculated from pooled data for corresponding trials within subjects, and then averaged across subjects. (B) Results for the subjects who received no instructions regarding changes in likelihood width.
