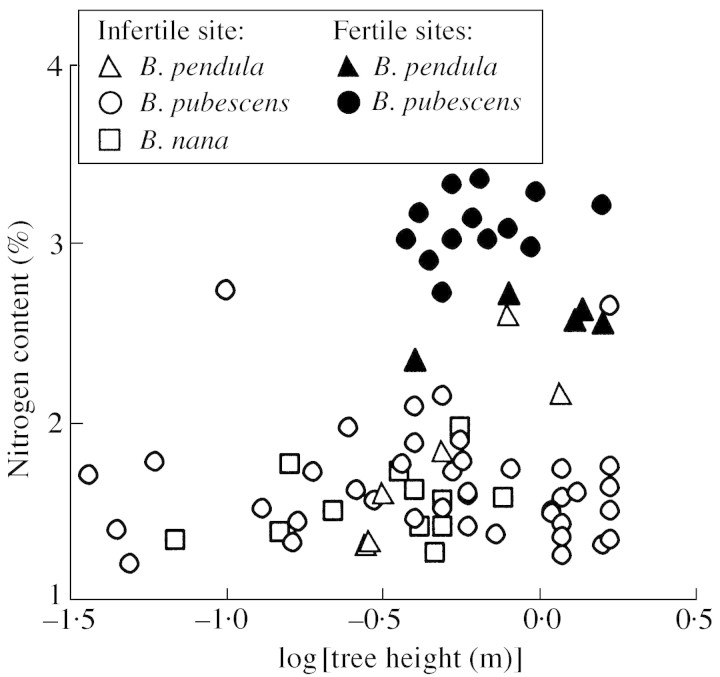
Fig. 1. Scatter plot of foliar nitrogen content per unit dry mass vs. total tree height. The data were sampled from the bog (poor site) and from the clear fell sites in Viimsi (B. pubescens) and forest edges in Voore (B. pendula, Table 1). Average foliar nutrient contents (Table 1) provided the primary criterion to distinguish the sites on the basis of nutrient availability (fertile vs. infertile). The same symbols are used for the Viimsi data because (1) the primary difference between the Viimsi sites (Viimsi‐1, and Viimsi‐2, Table 1) was only the age of the clear fells, and (2) the sites did not differ in measured soil characteristics and foliar nutrient contents. The linear correlation is non‐significant (r = 0·21, P > 0·06 for all data pooled).

An official website of the United States government
Here's how you know
Official websites use .gov
A
.gov website belongs to an official
government organization in the United States.
Secure .gov websites use HTTPS
A lock (
) or https:// means you've safely
connected to the .gov website. Share sensitive
information only on official, secure websites.
