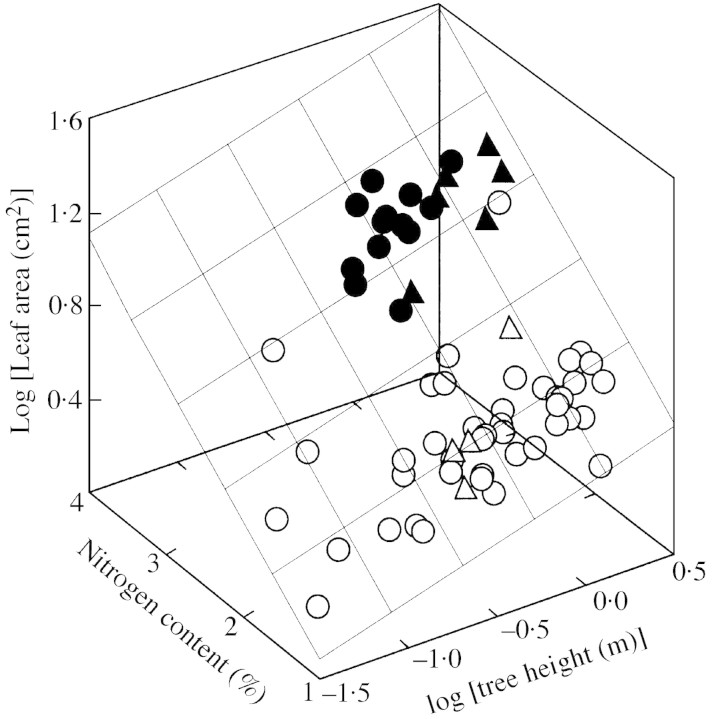
Fig. 2. Dependence of leaf size on foliar nitrogen content and on total tree height in Betula nana, B. pendula and B. pubescens. All data were fitted by a single multiple linear regression: logS = –0·190 + 0·358logH + 0·447NM (r2 = 0·60, P < 0·001 for both logH and NM, P > 0·1 for the intercept). Symbols as in Fig. 1.

An official website of the United States government
Here's how you know
Official websites use .gov
A
.gov website belongs to an official
government organization in the United States.
Secure .gov websites use HTTPS
A lock (
) or https:// means you've safely
connected to the .gov website. Share sensitive
information only on official, secure websites.
