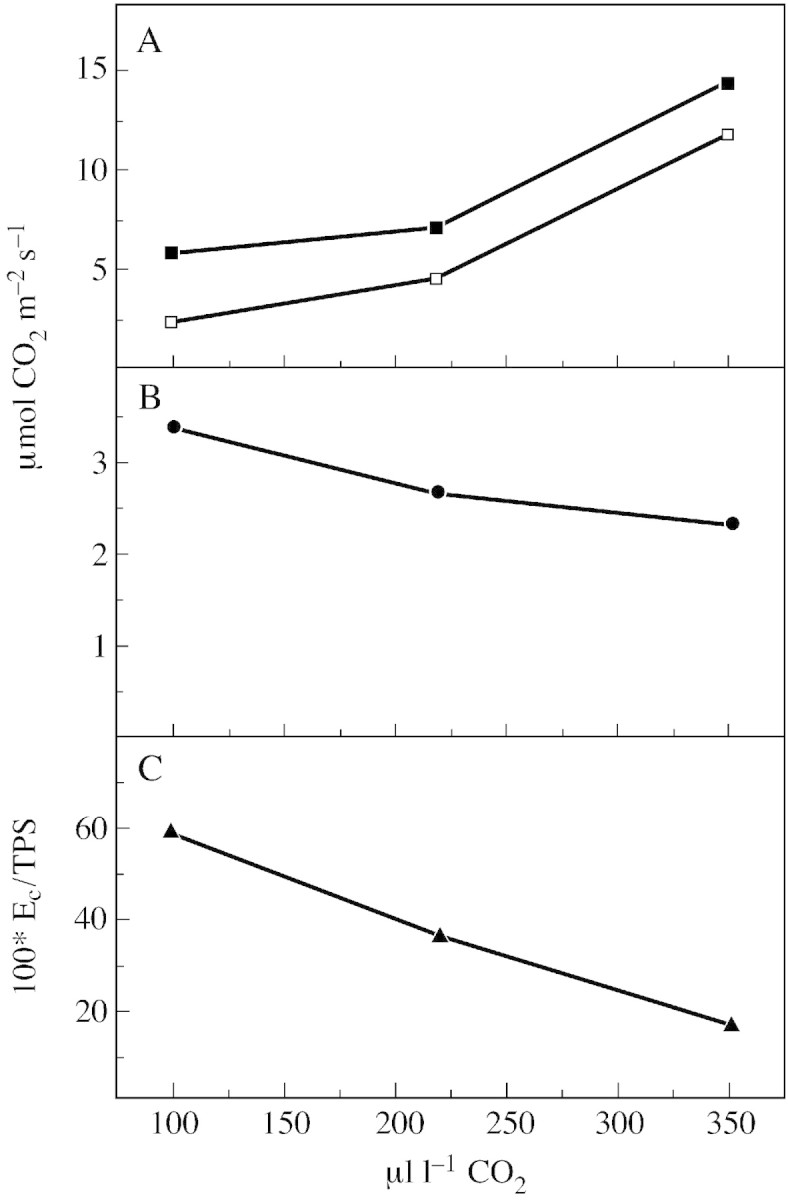
Fig. 3. Rates of gross CO2 uptake (TPS, closed squares), net CO2 uptake (PN, open squares) (A) and gross CO2 evolution in the light (EC) (B) by attached leaves of wild‐type tomato during steady state photosynthesis at saturating light intensity (850 µmol photons m–2 s–1) in relation to ambient CO2. C, Ratio of EC/TPS. Measurements were made in an open gas exchange system using a 12CO2 /13CO2 isotope technique. Leaves (23 cm2) were supplied with air (gas flow 50 l h–1) containing 210 ml l–1 O2 and 350 µl l–1 12CO2, or 250 µl l–1 12CO2 or 100 µl l–1 12CO2 at 70 % relative humidity and 23 °C. When steady state photosynthesis was reached 12CO2 uptake was measured. Then 350 µl l–1 13CO2 (or 250 µl l–1 13CO2 or 100 µl l–1 13CO2) in 21 % O2 was supplied for 1 min and 13CO2 uptake as well as 12CO2 evolution were determined. From mass spectrometer readings, TPS, PN, EC and the ratio of EC/TPS were calculated. Points are means of six replicates; s.e. ≤ 10 %.
