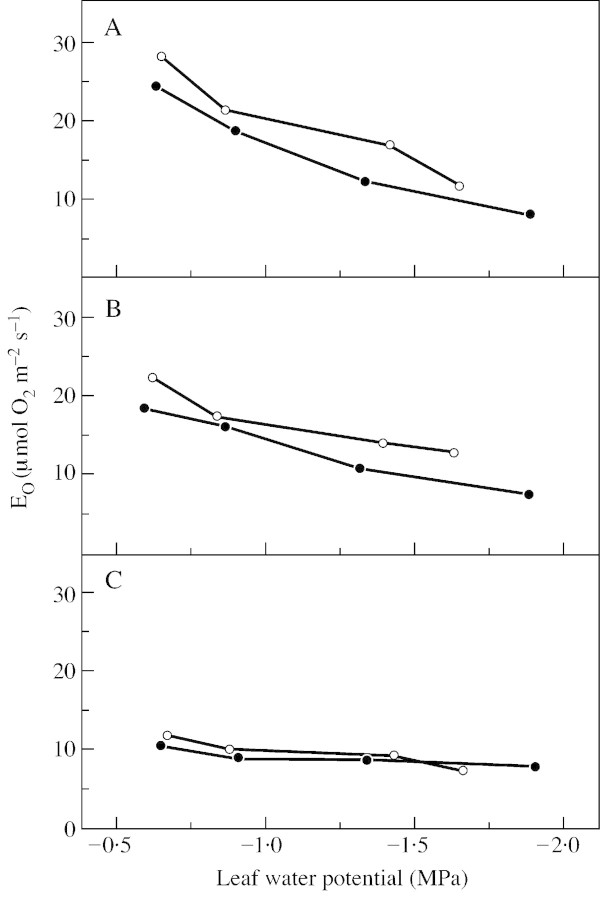
Fig. 4. Gross oxygen evolution (EO) of attached leaves of wild‐type tomato (closed circles) and the hp‐1 mutant (open circles) during steady state photosynthesis at three different light intensities [850 (A), 400 (B) and 90 (C) µmol photons m–2 s–1] in relation to leaf water potential. Measurements were made in a closed gas exchange system using a mass spectrometric 16O2/18O2 isotope technique. Leaves (23 cm2) were supplied with air (gas flow 50 l h–1) containing 350 µl l–1 CO2 and 210 ml l–1 18O2 in N2 at 70 % relative humidity and 23 °C. Points are means of six replicates; s.e. ≤ 10 %.

An official website of the United States government
Here's how you know
Official websites use .gov
A
.gov website belongs to an official
government organization in the United States.
Secure .gov websites use HTTPS
A lock (
) or https:// means you've safely
connected to the .gov website. Share sensitive
information only on official, secure websites.
